Possibilities and Limitations of Leak Testing Using Pressure Decay Methods
Find out in our article about the possibilities and limitations of leak up tests with vacuum and overpressure decay methods, particularly in the context of vacuum furnaces. We explain how these methods work, which parameters play a role and how the results can be interpreted. We also discuss typical challenges that can arise specifically with vacuum furnaces and give practical tips on how to carry out the test. Read on to find out how you can check the tightness of your vacuum furnaces precisely and efficiently.
Pressure change methods can be used to determine whether there is a relevant leak in a container. For this purpose, the container is pressurized to test pressure, tightly closed and the differential pressure is evaluated after a period of time. The test pressure can either be less than atmospheric pressure (around 1.013 mbar), i.e., the container is evacuated and the increase in pressure is observed. Or the container is over-pressurized, and the pressure decrease is evaluated.
As absolute tightness does not technically exist, specified maximum permitted values for the pressure increase or pressure decrease and thus the leakage rate are used as an assessment criterion. The test direction (underpressure or overpressure) should be selected that corresponds to the application.
Fundamental procedure
The following parameters play a role in pressure increase and pressure decrease test methods (or pressure decay methods). These are mainly:
- Limit leakage rate QL [mbar * l/s]
- Volume V [l]
- Test time Δt [s]
- Pressure difference Δp [mbar] or [Pa]
Their relationship is as follows:
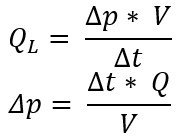
= pressure change [Pa] or [mbar]
v = volume [m³] or [l]
= measuring time [s]
Q = leakage rate [Pa.m³/s] or [mbar l/s]
Example: In relation to a vacuum furnace, it could look like this:
A container with V = 1000 l is left to stand overnight Δ t = 10 h = 10 h*60 min/h*60 s/1 min =
36,000 s. The next morning, a pressure change of Δp = 0.5 mbar was noticed.
The formula becomes the present one Leakage rate calculated.
Conversely, one could also calculate the permissible pressure increase Δp if the maximum allowable leakage rate is known. Assume QL would be 3 * 10-5 mbar*l/s. Then the maximum permissible pressure increase for our container with V = 1000l and a measuring time of 10 h

No matter which route you choose, the result is compared with the permitted value, which provides information about whether the example vessel is tight enough or not. But be conscious that this only works if the environmental conditions are right.
Factors to consider
Limits of the resolution of measuring devices
The measuring devices used must be able to display the expected pressure change.
Example: For a pressure decrease test with air as the test medium, absolute pressures between 2 and 5 bar are common. For a container with V = 5 l, a test time of 1 h = 3,600 s and a leakage rate in the range 10^-6 mbar * l/s, the calculated pressure decay is

The pressure change of 7.2 * 10^-4 mbar is not visible on a scale of 5 bar because measuring devices with such a high resolution are not available.
It must also be remembered that the measuring method is also suitable for the gas or gas mixture present. For example, a heat conduction measuring principle (Pirani gauge) is dependent on the type of gas, which can lead to incorrect display values.
Solution: “Think about what you want and can measure beforehand, and what is necessary for this”
Influence of volume on pressure
The size of a leak does not depend on the volume of a container. This means that, for example, the leakage rate of 1*10^-6 mbar*l/s always remains the same, regardless of whether the leak is in a vessel with a volume of 5 l or 1,000 l.
But what changes with the container volume at a constant leak rate is the pressure decay:
The larger a container volume is, the longer it takes until the volume flow through the leak causes the same pressure decay as in a smaller container.
Δ p: Because , the pressure difference becomes smaller as the container volume increases.
Conversely, the smaller the container, the greater the pressure difference.
Example: The pressure difference is determined on two containers, which differ only in terms of their volume, after waiting one hour ( Δ t = 60 min = 3,600 s) and the known leakage flow of Q = 3*10^-5 mbar* l/s :

In the container with a volume of 1000 liters, the leakage flow causes a pressure change of Δp1000 = 1.08 * 10^ -4 mbar within one hour. In comparison, the pressure change in the container with a volume of only 5 liters is Δ p 5 = 2160 * 10^ -4 mbar, which corresponds to a factor of 2000.
It follows that: The larger the container, the longer the test time Δt must be selected so that the pressure change test can be successful.
Influence of dimensional stability (or elasticity of the test object)
Testing elastic containers (including those made of steel) can be problematic because the change in volume caused by deformation when the pressure changes can compensate for a pressure loss. A common example of this is the change in volume of a balloon that has a hole. This can make a meaningful test impossible.
Influence of cycle time
Pressure decay tests are also carried out in series production. When considering this method, however, one must keep in mind that the cycle time increases as the size of the test object increases. If the cycle time becomes too long and the cycle time becomes too slow, it is possible that this method can no longer be used economically in series production.
Influence of temperature
With the ideal gas equation

with pressure p [Pa], volume V [m³], mass m [kg], molar mass M [kg * kmol-1], general gas constant R [J*kmol-1 *K-1] and absolute temperature T [K]
the relationship between pressure, volume and temperature can be presented in a simplified manner.
Closed container: If a quantity of gas enclosed in a container remains constant in volume, then this state is called isochoric. In a closed system, the mass and type of the enclosed gas do not change (so the mass and molar mass remain the same).
To find out what influence temperature has on pressure, we rearrange the formula and isolate all constant influencing factors (m, R and M):

, where m*r *1/M = constant C
What remains:

The formula says that the pressure p (left side) depends on temperature and volume (right side):
- The temperature is at the top, if the volume remains the same and the temperature increases, then the pressure increases. If the temperature decreases, the pressure decreases.
- The volume is at the bottom of the fraction. If the volume increases while the temperature remains the same, the pressure decreases. If the volume decreases, the pressure increases.
We keep: In the case of temperature fluctuations, this has an influence on the pressure. It is therefore not possible to compare the initial pressure p1 at temperature A with the final pressure p2 at temperature B without considering the error due to the temperature difference.
However, the influence of temperature on pressure can also be utilized: If I bake out a heatable system and evacuate it at temperature to the final pressure, and then allow it to cool down, the final pressure will be lower at a constant cold volume.
Interpretation of the obtained time-pressure curve
In addition to the pure interpretation of the value obtained after the test time, i.e., pressure difference or leakage rate, other findings can be interpreted from the values. Various parameters can often be recorded via the built-in sensor system, which usually includes the pressure plotted over time. With a little practice, you can determine which measures need to be carried out next (The sketches assume that the pumps are physically separated or switched off during the test and that the temperature is constant):
a)
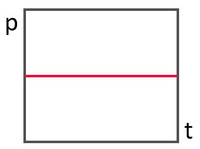
No change in pressure - no leak - no action required.
b)
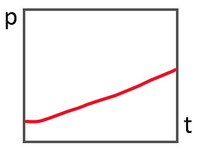
Almost linear curve - indicates a relatively constant leakage flow - action required, i.e., find and rectify leak).
c)
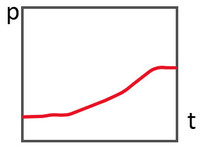
Curved pressure curve - indicates a non-constant leakage flow - action required. These pressure curves are often so-called virtual leaks.
In case c) there is a large change in pressure per time at the beginning, which decreases over the course of the test. This indicates that something is happening inside the container, for example something is outgassing. This is called a virtual leak; We will discuss this topic in more detail in another article. But be careful, it is also possible for outgassing to mask a real leak. That's why you should try to rule out possible virtual leaks right from the start. This can be done, for example, by not having any other products in the chamber that you want to test, such as test specimens. Or by evacuating for as long as possible before the actual test - this significantly reduces “finite” virtual leaks such as moisture in the system.
We note: Depending on what the time-pressure curve looks like, you can conclude which measures lead to the goal of sufficient tightness. With increasing experience in interpretation, you can save more and more time in troubleshooting.
Vacuum furnaces – what’s special here?
In more complex vacuum systems, as vacuum furnaces often are, the complexity increases because different effects can overlap, eliminate, or add up. This includes temperature and pressure conditions at various locations in the system, the respective atmosphere, and material-related characteristics. The good news at the beginning: By heating the system and pumping it out for as long as possible (for example overnight or a whole weekend) before the leak up test, unwanted disturbances can be minimized, and the result will be more precise. This procedure can often avoid helium leak detection.
Disturbance variable air humidity
If baked out systems are left open, moisture from the air will be drawn into the system. This is particularly the case if the material in the container is hygroscope, i.e., attracts water. In addition, the larger the surface area on which water can attach, the greater the adsorption effect. For example, if you have a system that is insulated with graphite felt, then both are true: the material is hygroscope and, on top of that, has a very large surface area due to its structure (the surfaces of each individual felt fiber add up, not only the plate size is relevant). Depending on the size of the system, relevant quantities can be collected in just half an hour. Pumps need a correspondingly long time to evaporate the moisture and transport it out of the vessel. When condensation occurs, moisture from the air accumulates on cooled system components. It helps to counteract both effects by keeping the furnace closed as much as possible.
Disturbance variable outgassing
In addition to moisture, any other substance present in the container can also be misleading: If the system is heated with graphite resistance heaters, it is possible that the graphite will outgas. As well as affecting the vacuum, this can also lead to unsightly deposits and discoloration. The same applies to oils and fats in the system, especially in UHV systems, which are pumped out to levels of 10 -8 mbar and lower. Even fingerprints leave a lasting temporal impression here. It happens, especially to newcomers to vacuum technology, that they install seals with grease or oil in order to seal them better, which results in extensive cleaning. If in doubt, ask beforehand what is allowed and what is not.
The washing process as a possible source of faults
But it's not just the vacuum furnace that offers potential for outgassing. Steel parts are often protected from corrosion with oil between production steps. This is usually washed off before heat treatment processes so that it does not have an undesirable effect on the result. If the oil is not washed off, it can lead to outgassing and discoloration in the vacuum process. If it is washed off but the part is not dried reliably, the water can evaporate in the vacuum process, leading to outgassing and discoloration. Cleaning agent residues such as soap or lye residue can also cause problems. Depending on how the fixtures and the parts are designed and charged, relevant quantities can also be carried over into the chamber.
Air leak or water leak?
In addition to the classic air leak, it is also possible in heated systems for cooling water to enter the system through a leak, for example in the heat exchanger or in the jacket. Apart from the fact that this represents a major safety risk at larger leakage rates and higher temperatures (keyword: pressure that arises from the sudden increase in gas volume when water evaporates), it is best not to ignore water leaks, even at room temperature and at very low leakage rates. How to distinguish them from air leaks? This is often possible in the pressure increase test by evaluating the time-pressure curve using the saturated vapor pressure:
If the pressure in the container rises to the saturated vapor pressure of water – roughly a little over 20 mbar at room temperature - and does not increase further, then it is usually a water leak. The saturated vapor pressure is the pressure at which the gaseous state of matter is in equilibrium with the liquid or solid state of matter. This means that you continue to draw water vapor from the container, but new water comes in through the water leak, some of which evaporates again until equilibrium, i.e., the saturated vapor pressure, is reached.
Limits of the leak up test
Ideally, a vacuum furnace is evacuated and baked for a long time, then the pumps are physically separated and switched off. This means that there is no pumping during the test. The vessel is then tested for leaks, including the fittings that are spatially in the same pressure space. For example, everything that sits behind a closed gate valve or angle valve is not tested. But this also means that even if the main room is tight, there can still be leaks in the pipework or valves behind the shut-off.
We hang on to:
A vacuum decay test is an effective way of checking the tightness of a vacuum furnace, particularly after maintenance or repair, but also after a certain period of operation for safety reasons. If the method is carried out in a technically clean manner, the result is very informative and provides more information in a shorter time than helium leak detection. As an integral test, the leak up test can also provide a quantitative statement. When finding leaks using helium spraying, the situation is the other way around: This method is suitable for finding leaks (qualitative statement), but it does not provide a reliable statement about the exact size or leak rate of the leak found.

